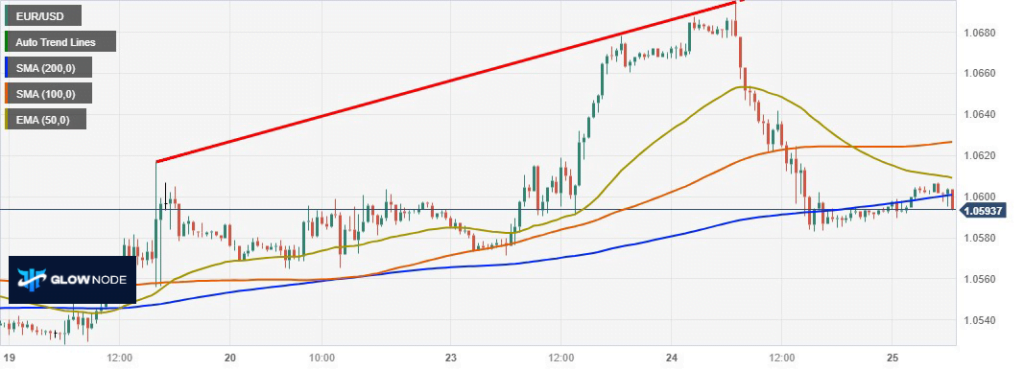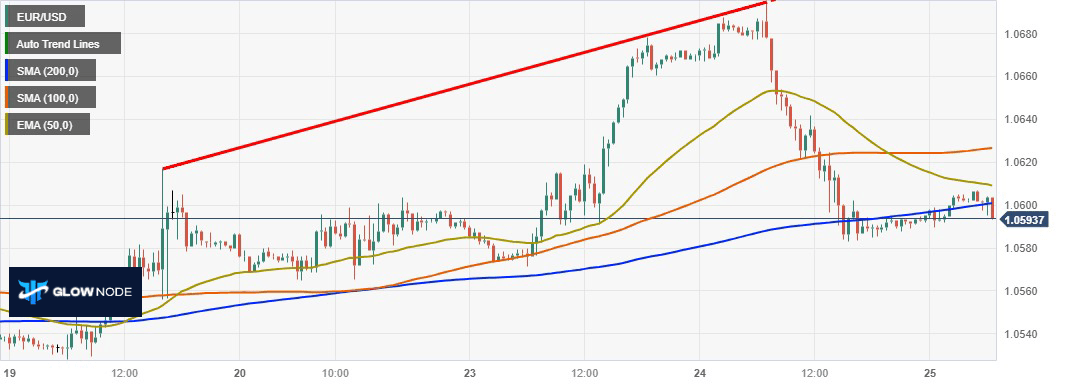
1. Price Movement: The EUR/USD pair experienced a sharp pullback from a fresh monthly high near 1.0700 on Tuesday. It dropped to the 1.0580 region and is currently slightly below the 55-day Simple Moving Average (SMA). This retracement erased the gains made on Monday.
2. Moving Averages: The pair has remained above the flat 20-day SMA at 1.5060. A drop below this level could be a signal that the Euro’s rally, which began in early October, may be coming to an end.
3. 4-Hour Chart Analysis:
– Indicators and 20-SMA: The 4-hour chart shows both technical indicators and the price trading below the 20-SMA, indicating potential weakness.
– Support Levels: The next support level to watch is at 1.0570, followed by the zone around 1.0545, which is a crucial short-term area with a downtrend line.
– Further Support: A break below the 1.0545 level could open the doors to more losses, with initial targets around 1.5025 and then the 1.0500 area.
4. Potential Bullish Scenario: On the other hand, if the Euro manages to rise above 1.0610, it could alleviate bearish pressure, and the rally may resume if it consolidates above 1.0640.
In summary, the analysis suggests that the EUR/USD pair has recently experienced a significant pullback from a monthly high. Key support levels and a critical short-term area have been identified, and further losses may occur if these levels are breached. Conversely, a move above certain resistance levels could signal a potential resumption of the Euro’s rally. Traders should consider this information alongside other factors when making trading decisions and perform additional research as needed.

